Converting

users

to

content

creators

@

I

increased

user-to-creator

conversion

by

75%

through

a

redesign

of

the

event

creation

experience,

reshaping

what

Clyx

events

can

be

without

reducing

average

engagement.

Role:

UX Lead

Duration:

Design and delivery: 4 weeks, experimentation: 2 weeks

Skills:

User

analytics,

interviews,

UX/UI,

prototyping,

usability

testing,

PRDs,

post-release

monitoring

Tools:

Figma,

FigJam,

Notion,

Mixpanel,

Zoom,

Typeform,

OneSignal

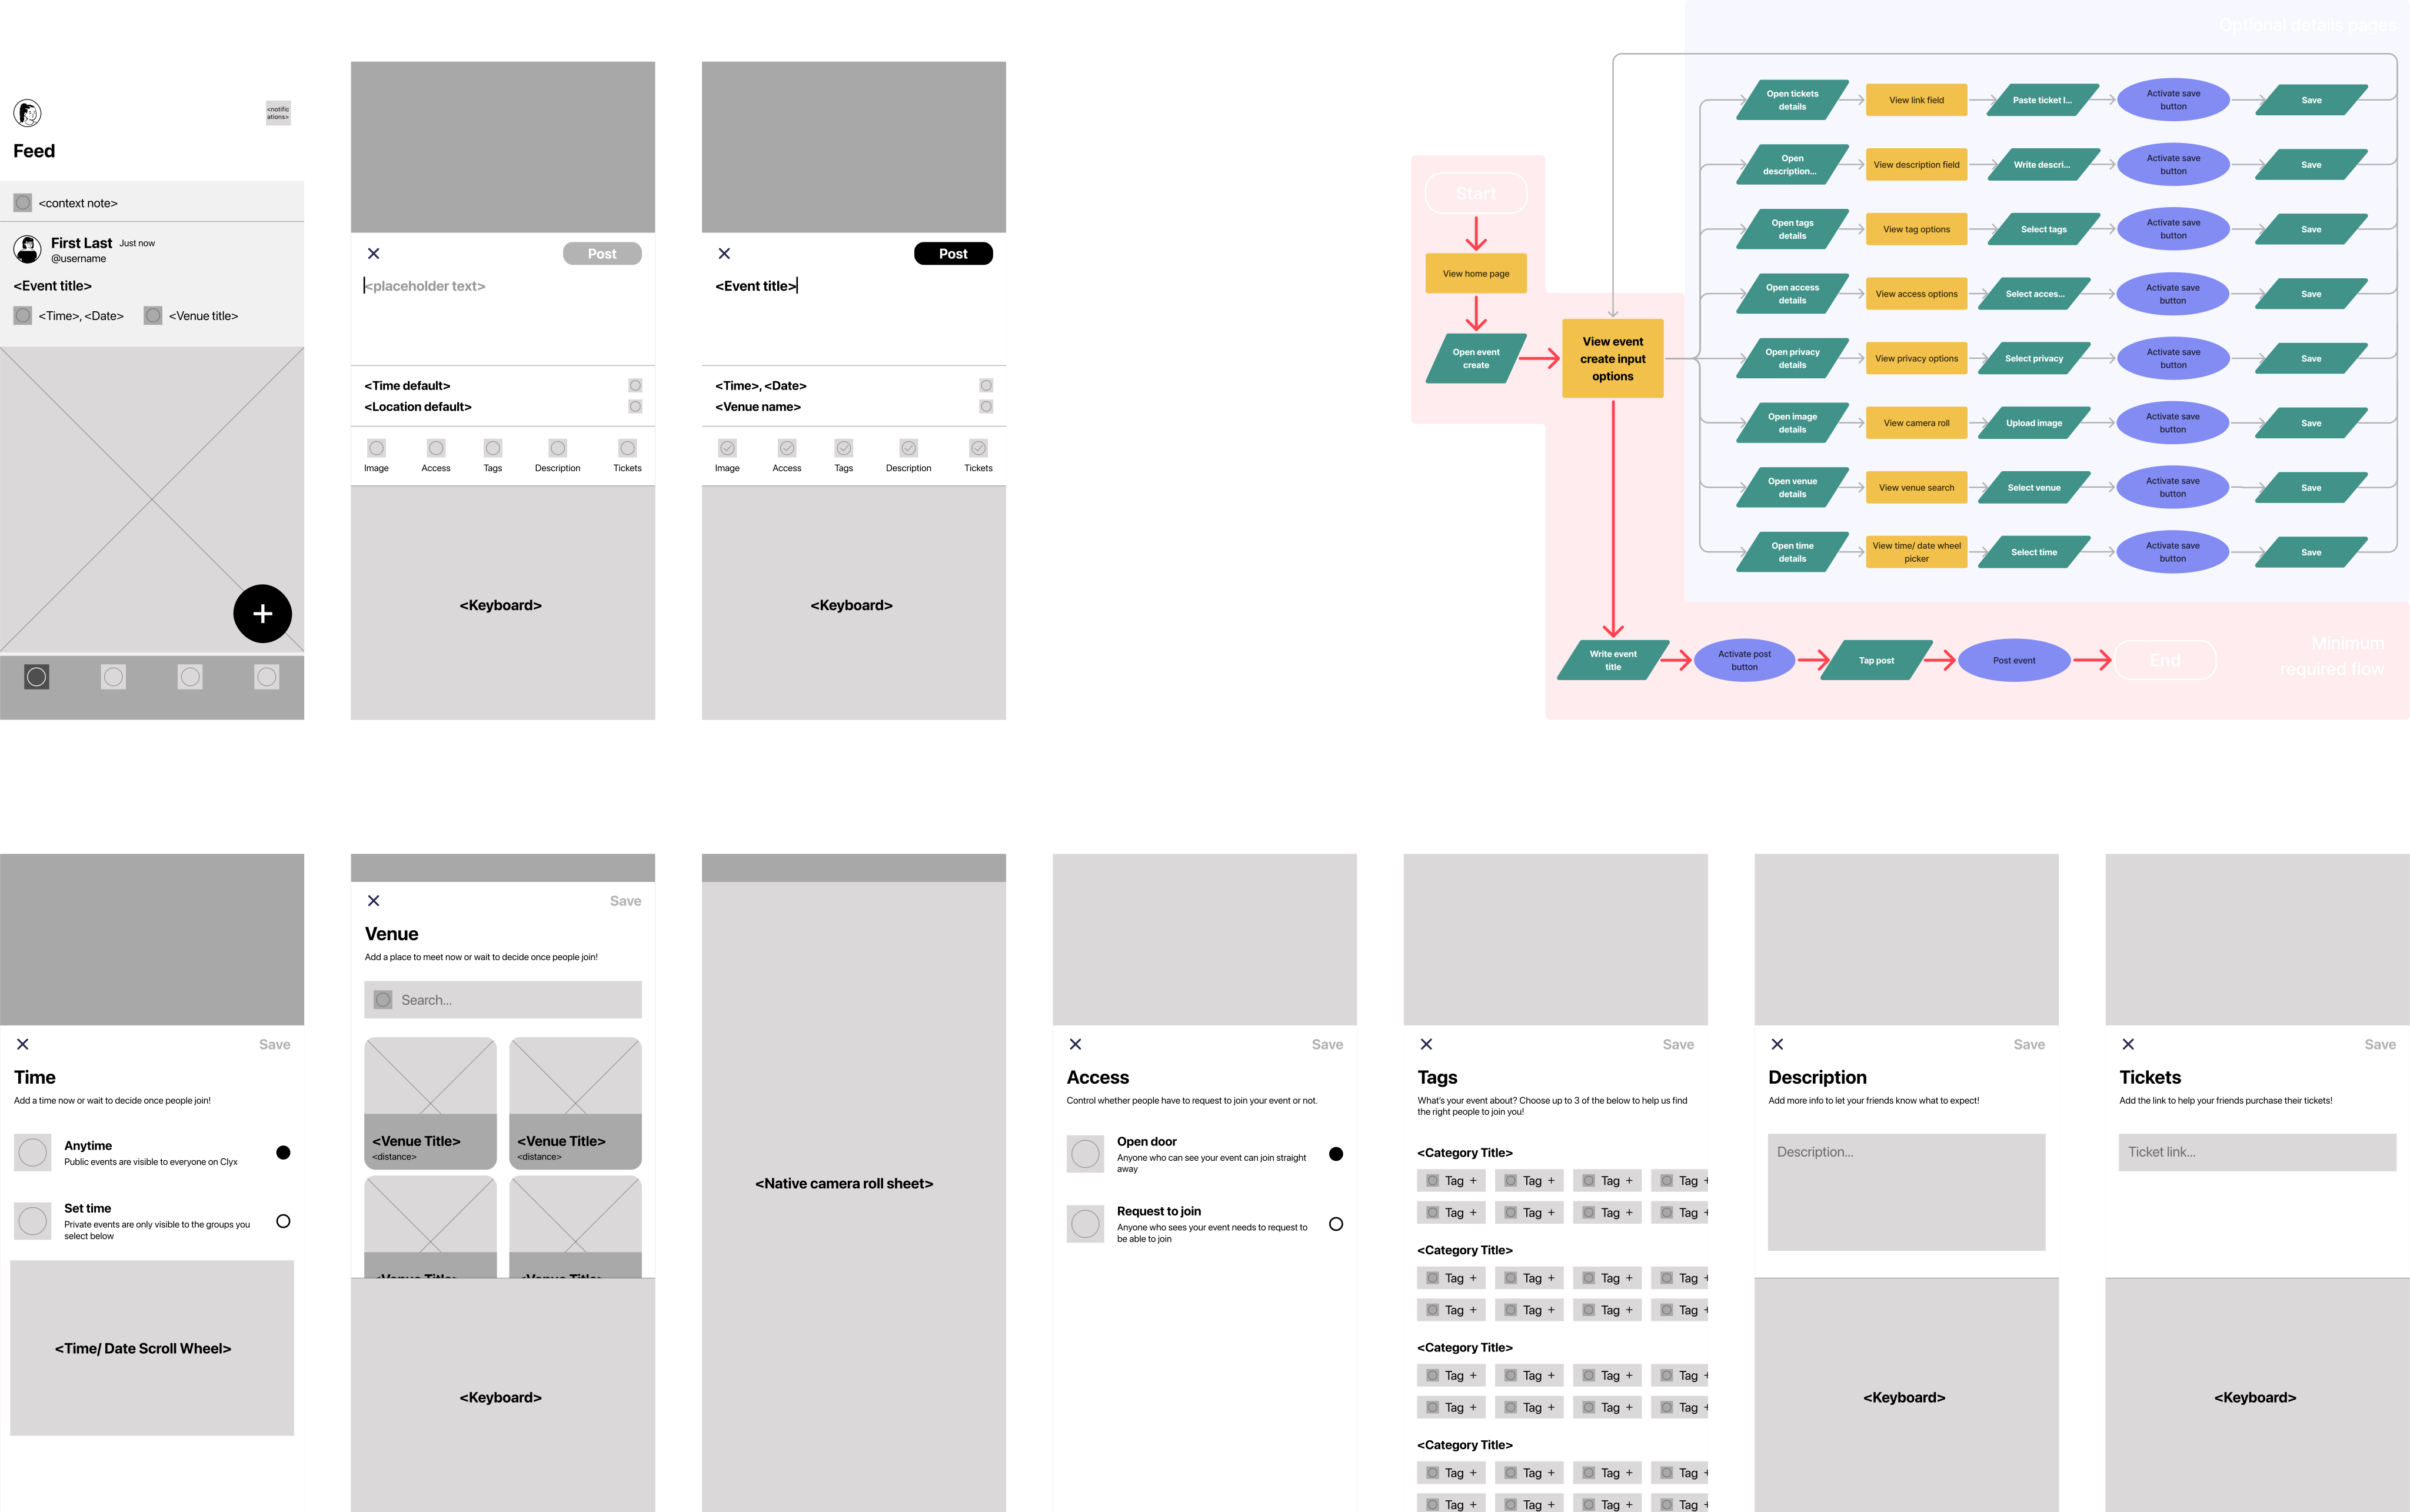
Clyx creation flow
My role

As UX Lead, I owned the initiative from problem identification through launch and measurement. I analyzed the creation funnel, defined success metrics and downstream engagement guardrails, conducted user research, evaluated alternative product architectures, translated the selected approach into requirements and designs, and partnered with growth and engineering to ship and assess the release.

Context

Clyx relied on user-created events to make the product feel active, locally relevant, and socially useful. However, only a small proportion of users went on to create an event themselves, limiting the supply and variety of experiences available across the platform.

The challenge was not attracting users into the creation flow - 78% opened it at least once during their lifecycle. We needed to convert more of that existing intent into published events while maintaining downstream engagement.

Question

The majority of users opened the creation flow during their lifecycle but only a minority completed the process to organize an in-person event.

How do we encourage more users to post without degrading event quality?

Scoping

In-scope

Changes to the content creation flow

Required details for event creation

Out-of-scope

Redesigning the home or discovery system

Changing the creation flow entry point

Defining success
01

User-to-creator conversion

% of MAUs who created at least one event during the two-week test window.

02

Creation-flow completion

% of creation-flow starts that resulted in posting during the two-week test window.

03

Change in per-user event engagement

Average events joined per MAU per week during the two-week test window.

Research

To understand why more users weren't creating events, I first conducted exploratory data analysis of the creation funnel and the kinds of events being created. This indicated that the great majority of content was for large-scale, organized events. Additionally, those completing the creation flow tended to specify most or all event parameters despite the ability to skip. Users who did not complete the flow frequently dropped off across the five detail-selection pages.

A key positioning insight came from previously conducted user persona research, highlighting an underserved small-event host segment: people who wanted to create casual events without extensive preorganization.

Diagnosis 01: The existing flow had substantial avoidable friction.

Diagnosis 02: Clyx’s event model appeared more formal than intended.

Hypothesis: The linear, detail-heavy flow increased both perceived effort and perceived formality. Reducing perceived and actual upfront commitment would increase event posting without materially reducing event engagement.

Process
Prototype evaluation framework
Time on task

Quantitative

How long do users take in each phase and overall?

Error patterns

Qualitative

Where in the flow are users getting stuck?

Comprehension

Qualitative

How confident do users feel while using it?

Desirability

Qualitative

Which experience do users prefer?

Interview topics

Event content formality perceptions

Willingness to post events at different levels of event finalization

Willingness to join events at different levels of event finalization

Perceived event quality at different levels of event finalization

Key research insights
01

From usability testing

Users struggled with too many detail options

Users frequently slowed down or got stuck while filling in event details that were unconfirmed, time-consuming to source, or irrelevant to the event.

02

From usability testing and interviews

The previous linear flow increased perceived effort

Requiring users to move page by page through event details increased perceived effort, even when individual fields could be skipped.

03

From interviews

Users overestimated formality

Presenting too many inputs, particularly required inputs, as part of the standard flow caused users to overestimate how formal a Clyx event needed to be.

04

From usage analytics and interviews

The benefit of finalizing before posting was negligible

Users were happy to join events and help finalize the details based on what worked for the group, likining it to group chat-style organization.

Key trade-offs & mitigations

Redefine the minimum viable event

Action: Require only a title before posting

Rationale:

Each detail requirement created barriers without a corresponding improvement in willingness to join.

Presenting eight event details to fill in appeared to contribute to users overestimating how formal an event needed to be.

User persona and market research highlighted an underserved segment of small event hosts.

Trade-off: Publishing incomplete events could reduce clarity or usefulness.

Mitigation: Preserve easy access to optional details and follow up with additional event management flow iterations as necessary.

Trade-off: Event time and place were key algorithm parameters.

Mitigation: Using host location as a proxy and weekend timing assumptions, we could maintain recommendation scoring.

Trade-off: Event category tags were key algorithm parameters.

Mitigation: Simple keyword detection on event titles supported automated category tagging.

Replace the linear flow with progressive disclosure

Action: Replace the sequence of detail pages with a central creation hub and optional subpages.

Rationale: Even with skippable steps, sequential ordering still appeared to increase perceived effort.

Trade-off: A hub provides users with more freedom but less step-by-step guidance.

Mitigation: Group fields hierarchically by importance and make the publishing path visually dominant.

User flow & wireframing

Choice

Decision

Flow architecture - linear vs. hub-based

Hub-based, avoiding any unnecessary funnel steps

Required information - all details vs. reduced requirements

Title only, emulating group chat-style organization

Detail presentation - equal prominence vs. progressive disclosure

Progressive disclosure, minimizing cognitive load

Event time and location - required decisions vs. editable defaults

Editable generic defaults, relying on group-based organization

Event image - secondary vs. tertiary detail

Tertiary, reducing pressure on a potentially costly detail to source

Designs

Primary event details

The event title is the only required detail and is displayed prominently at the top.

Secondary event details

Time and place use editable defaults, enabling users to decide before posting or later as others join.

Tertiary event details

Additional detail options remain out of the way but easily accessible.

Experimentation & release

We evaluated the redesigned creation experience through a two-week randomized A/B test. Eligible monthly active users were assigned evenly between the existing and redesigned flows, while events created through either experience remained visible across the same live social network.

15.87% of MAUs in the redesigned flow cohort (treatment cohort) created an event within the two-week period compared to 9.1% of MAUs in the existing flow cohort (control cohort) - a 6.8 percentage-point, or 75% relative difference. Creation flow completion was also higher amongst the test cohort, reaching 59.5% compared with 48% in the control experience.

As a downstream engagement guardrail, I monitored the average number of events joined per MAU per week. Average events joined per MAU per week was broadly equivalent between the treatment and control cohorts across the test period.

Impact

Conversion

75%

Higher conversion from user to content creator during the two-week test window.

15.9% treatment vs. 9.1% control - 6.8ppt higher.

Completion

24%

Higher completion rate from opening to posting during the two-week test window.

59.5% treatment vs. 48% control - 11.5ppt higher.

Downstream engagement

~0%

Change in average events joined per user per week during the two-week test window.

No material difference in average events joined per user per week.

Reflection

This project taught me to look beyond visible friction and examine the assumptions a product communicates through its structure. I also learned the importance of pairing a primary growth metric with downstream guardrails, particularly in products where increasing supply can affect the wider ecosystem.

If I were to approach the project again with the right resources and time, I'd make fewer changes at once to identify how each alteration affects creation behavior individually. This would provide a stronger foundation for post-release iterations.